Authors: Christophe Laummonerie,
Jerome Mutterer, Institut de Biologie Moleculaire des Plantes, Strasbourg, France.
Philippe Carl (maintainer), UMR7021, Strasbourg, France.
History: 2004/02/02: First version: Parts of the initial code were taken from plugins by W. Rasband, P. Bourdoncle, and G. Chinga.
2005/01/28: Version 1.1: Statistical methods added.
2006/08/29: Version 1.2
- Ratio bars non destructively displayed
- Works with any closed ROI
- Fire LUT better diplayed
- You now have to click in the ROI to update overaly image(s) and statistics
2016/03/21: Version 1.3
- Replacement of the deprecated functions (getBoundingRect, IJ.write) by the new ones
- Extension of the plugin for whatever picture dynamics
- Addition of a plot (with legends, ticks (minor and major), labels) within the scatter plot
- The selected points within the overlay picture are updated as soon as the ROI in the scatter plot is modified or dragged over
- Possibility to move the ROI position (within the scatter plot) from the mouse position within the overlay picture
- Possibility to set ROIs with given colors with a mouse double click
- Possibility to generate the x or y histogram with a Gaussian fit in order to extract the histogram maximum position by using the numeric pad 4/6 or 2/8 keys
2019/10/14: Version 1.4:
- Addition of scripting possibilities illustrated within the macro examples that can be downloaded here and here.
- The colocalization calculations are performed using double parameters instead of float
2019/12/15: Version 1.5:
- Possibility to add a selection within the Composite picture to restric the analysis to a given selection
- Addition of synchronized background thread for smoothly updating the calculations on the fly
2022/06/12: Version 1.6:
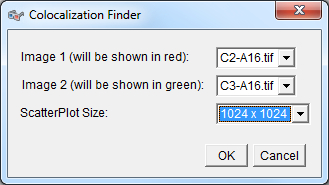
- Possibility to choose the size of the scatter plot upon start of the plugin
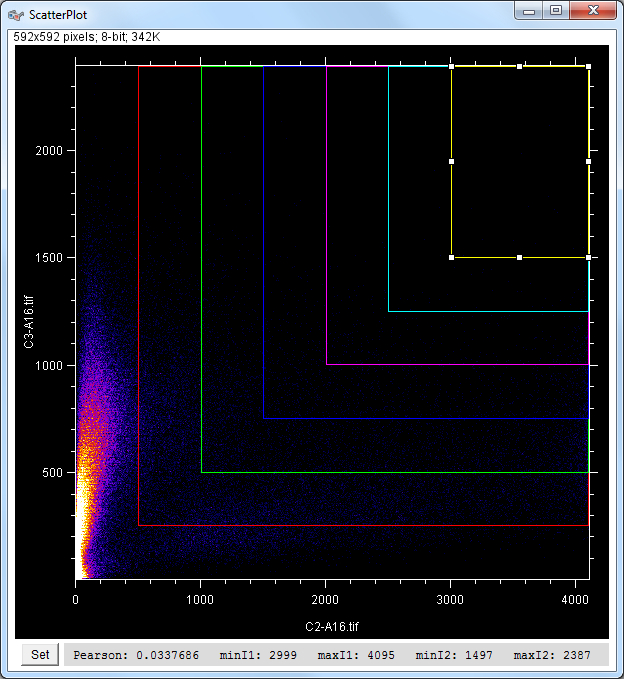
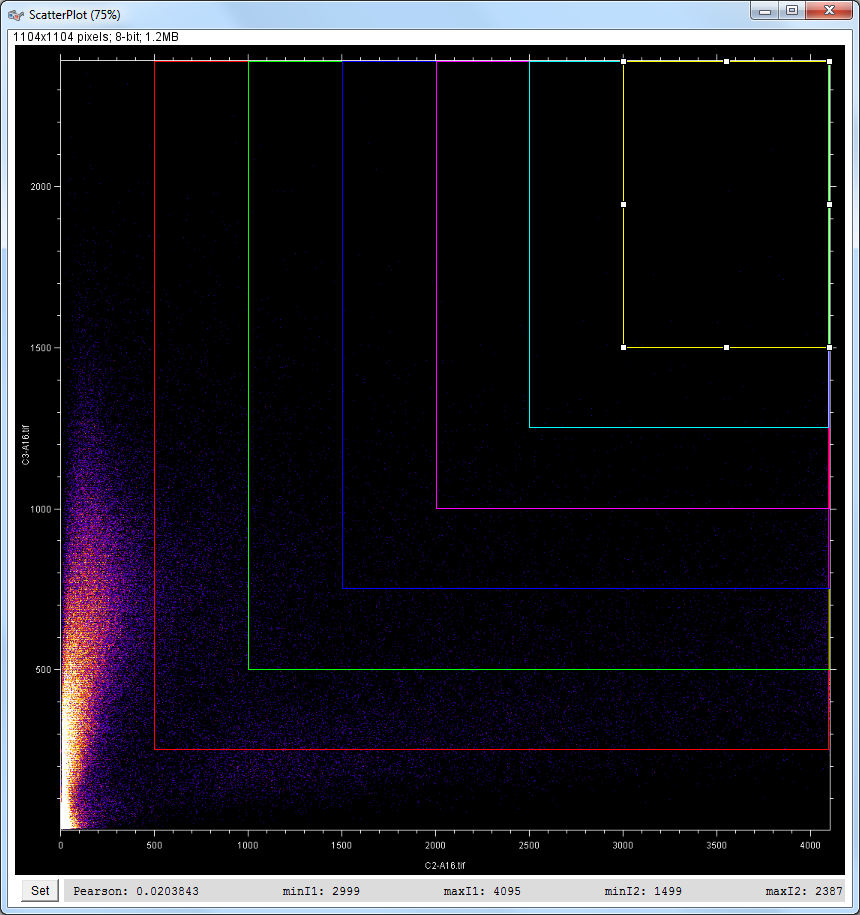
- Addition of a label panel at the bottom of the scatterPlot picture displaying the limits of the scatterPlot Roi selection (or other parameters upon selection)
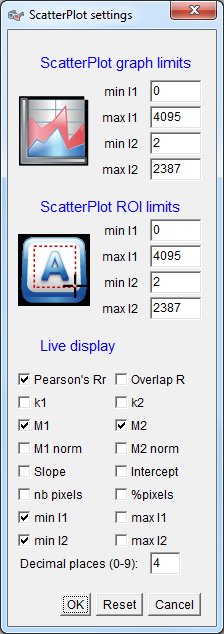
- Addition of a "Set" button at the bottom left of the scatterPlot picture allowing so set the limits of the scatterPlot graph and/or of the scatterPlot Roi and/or choosing the displayed parameters within the label panel at the bottom of the scatterPlot
(the 'g' key gives the same features)
- Addition of the Mander's coefficients (M1 & M2) calculation
- The possibility to set ROIs with given colors with a mouse double click has been erased (due to the ImageJ 1.53c 26 June 2020 update) and replaced by a Ctrl + mouse click user action
2023/03/18: Version 1.7:
- Possibility to choose the size of the scatter plot upon start of the plugin
2023/05/01: Version 1.8:
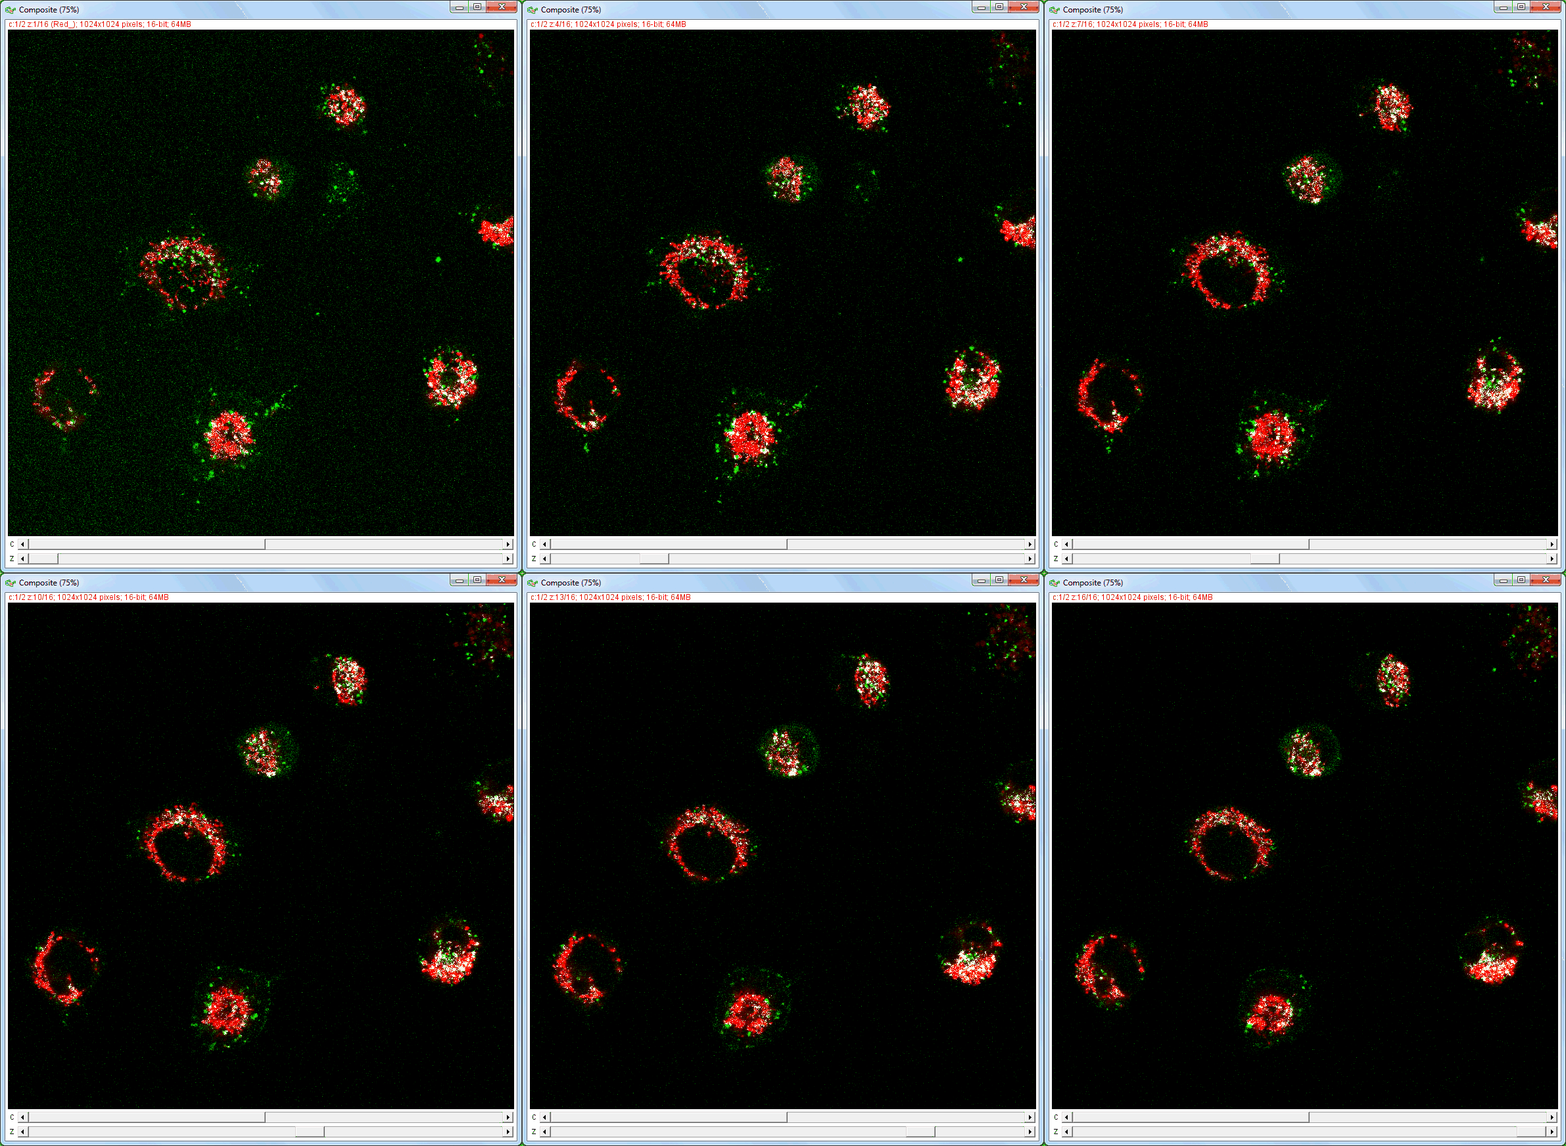
- The Colocalization_Finder plugin allows the analysis of image stacks
2024/06/20:
- Addition of macros for illustrating the questions within the How to paragraphSource: Contained in the JAR file. To open a JAR file, change the extension from ".jar" to ".zip" and double click on it.
or
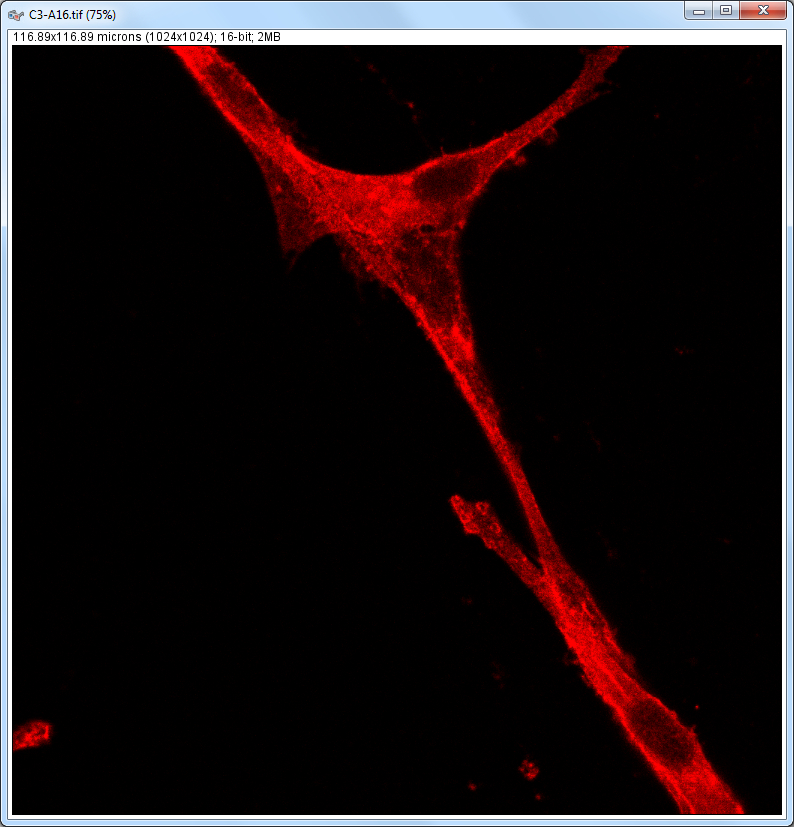
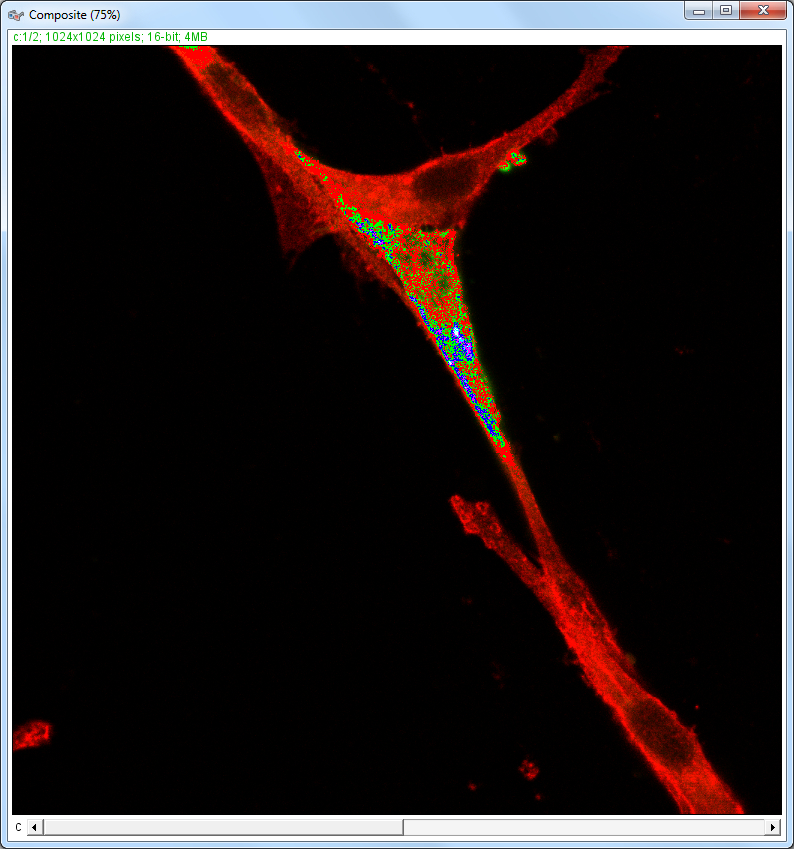
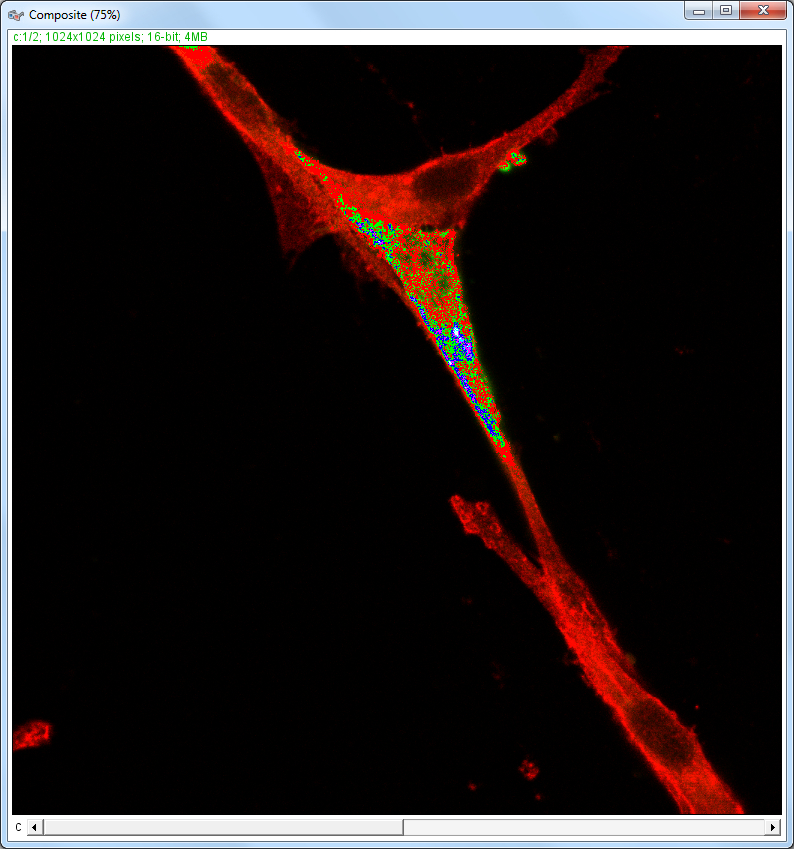
Download Colocalization_Finder.java.Installation: Download Colocalization_Finder.jar to the plugins folder, or subfolder, restart ImageJ, and there will the "Colocalization Finder..." new command in the Plugins menu. Description and features: This plugin displays a correlation diagram (called scatterPlot picture) from two initial pictures having the same size together with a RGB overlap of the original images (called Composite picture).
The initial scatterPlot plot limits correspond to the minimal and maximal intensity values of the input pictures.
The user interface of the plugin provides the following features:
- Drawing or modifying a selection within the scatterPlot (which limit values will be shown within a label panel at the bottom of the scatterPlot picture) allows to highlight the corresponding pixels within the composite picture.
- The selection within the scatterPlot can also be set through a dialog box opened either by the "Set" button (at the bottom left of the scatterPlot picture) or the 'g' key.
- The limits within the scatterPlot selection can as well be defined by using the macro instruction:
'call("Colocalization_Finder.setScatterPlotRoi", min1, max1, min2, max2);'
with:illustration within the following macro.
- min1: the lower intensity value of the first picture defined by the ROI, this value will be set to the minimal intensity value of the first picture in the case the set value is a whatever String (for exemple '' or "").
- max1: the higher intensity value of the first picture defined by the ROI, this value will be set to the maximal intensity value of the first picture in the case the set value is a whatever String.
- min2: the lower intensity value of the second picture defined by the ROI, this value will be set to the minimal intensity value of the second picture in the case the set value is a whatever String.
- max2: the higher intensity value of the second picture defined by the ROI, this value will be set to the maximal intensity value of the second picture in the case the set value is a whatever String.
- If the selection within the scatterPlot is deleted (for example with a by a single clic outside of the graph within the scatterplot window), it is automatically regenerated to its initial settings (i.e. covering all the scatterPlot).
- Drawing or modifying a selection within the Composite picture allows to restric the analysis to the given selection and will regenerate the corresponding scatterPlot picture accordingly.
- The analysis results of a given cross (i.e. scatterPlot and Composite pictures) selection can be generated with a single click inside either one of the selections.
- As a click inside either one of the selections (of the scatterPlot or Composite picture) together with the Ctrl key pressed will as well generate the given cross selection analysis results, but additionally add the scatterPlot selection within the roiManager attributing a given color to the corresponding ROI and colorizing the selected pixels within the Composite picture with the same attributed color by adding an overlay.
- By pressing the Shift key and moving the mouse over the Composite picture, the selection within the scatterPlot will be moving over placing it's center to the scatterPlot settings of the corresponding Composite picture pixel.
- By pressing the numeric pad 4/6 or 2/8 keys, the x or y intensity histograms will be generated together with a Gaussian fit in order to extract the histogram maximum position.
Plugin launching interface:
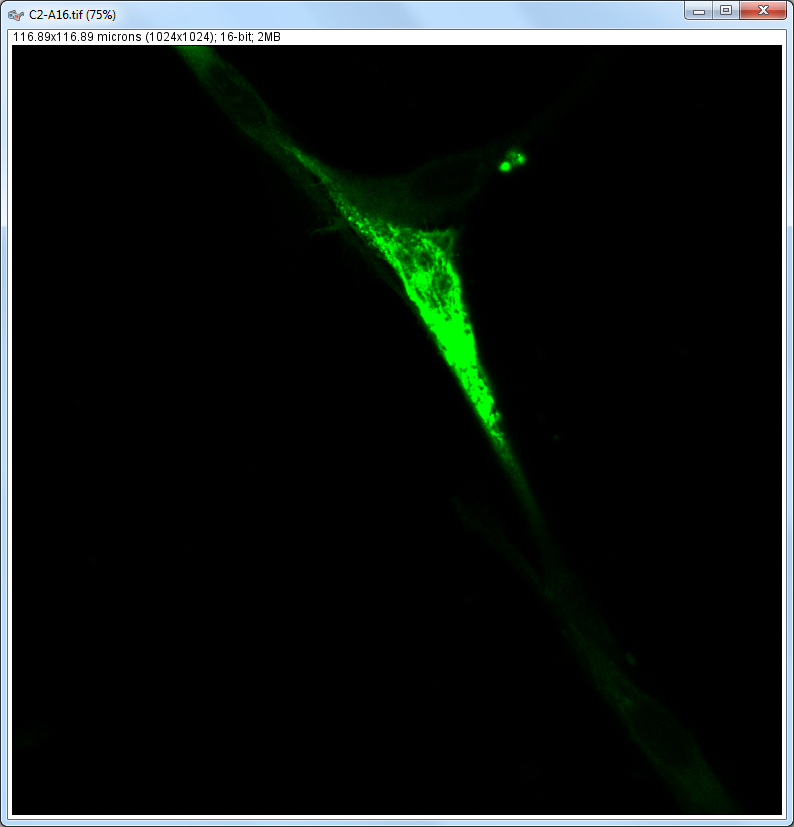
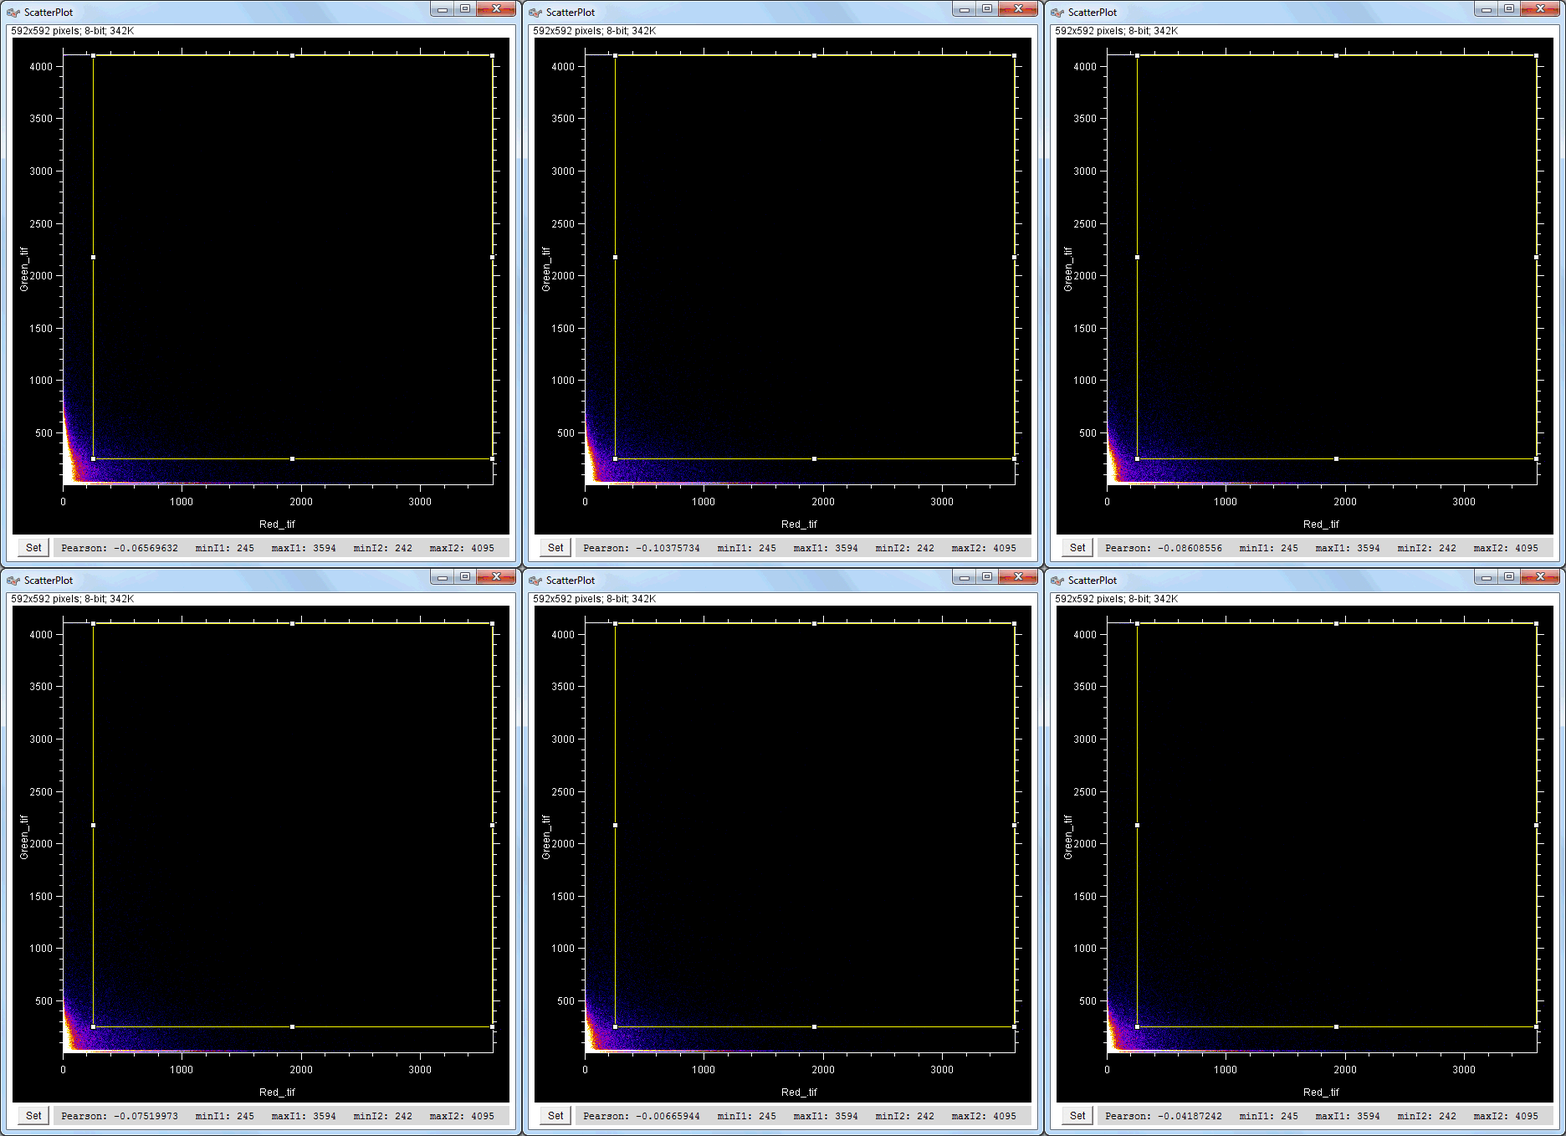
Example results (for a 512 × 512 scatterPlot):
Example results (for a 1024 × 1024 scatterPlot):
The results table with computer Pearson's correlation, Overlap coefficient, contribution of both channels to the overlap coefficient, Slope and intercept of the linear regression,% pixels selected, min and max in both channels.
with the Pearson's correlation coefficient calculated with the following equation: Pearson's_Rr \( \Large { = { 1 \over n-1 } \sum_\limits{i=1}^{n} { a_i \; - \; \bar a \over \sigma_a } \times { b_i \; - \; \bar b \over \sigma_b } } \)
with \(\bar a\) and \(\bar b\) being the average values of a and b, i.e. \( \large { \bar a = { 1 \over n} \sum_\limits{i=1}^{n} a_i } \) and \( \large { \bar b = { 1 \over n} \sum_\limits{i=1}^{n} b_i } \)
as \(\sigma_a\) and \(\sigma_b\) being the standard deviation of a and b, i.e. \( \large { \sigma_a = \sqrt { { 1 \over n-1 } \sum_\limits{i=1}^{n} ( a_i - \bar a )^2 } } \) and \( \large { \sigma_b = \sqrt { { 1 \over n-1 } \sum_\limits{i=1}^{n} ( b_i - \bar b )^2 } } \)
which gives: Pearson's_Rr \( \Large { = { 1 \over n-1 } \sum_\limits{i=1}^{n} { a_i \; - \; \bar a \over \sqrt { { 1 \over n-1 } \sum_\limits{i=1}^{n} ( a_i \; - \; \bar a )^2 } } \times { b_i \; - \; \bar b \over \sqrt { { 1 \over n-1 } \sum_\limits{i=1}^{n} ( b_i \; - \; \bar b )^2 } } } \)
\( \Large { = { 1 \over n-1 } \sum_\limits{i=1}^{n} { { (a_i \; - \; \bar a) \; \times \; \sqrt { n-1 } } \over \sqrt { \sum_\limits{i=1}^{n} ( a_i \; - \; \bar a )^2 } } \;\;\, \times { { (b_i \; - \; \bar b) \; \times \; \sqrt { n-1 } } \over \sqrt { \sum_\limits{i=1}^{n} ( b_i \; - \; \bar b )^2 } } } \)
\( \Large { = { 1 \over n-1 } \sum_\limits{i=1}^{n} { { \sqrt { n-1 } \; \times \; \sqrt { n-1 } \; \times \; (a_i \; - \; \bar a) \; \times \; (b_i \; - \; \bar b) } \over { \sqrt { \sum_\limits{i=1}^{n} ( a_i \; - \; \bar a )^2 } \; \times \; \sqrt { \sum_\limits{i=1}^{n} ( b_i \; - \; \bar b )^2 } } } } \)
\( \Large { = { n-1 \over n-1 } \quad\;\,\, { { \sum_\limits{i=1}^{n} ( a_i \; - \; \bar a ) \; \times \; ( b_i \; - \; \bar b ) } \over { \sqrt { { \sum_\limits{i=1}^{n} ( a_i \; - \; \bar a )^2 } \; \times \; { \sum_\limits{i=1}^{n} ( b_i \; - \; \bar b )^2 } } } } } \)
\( \Large { = \qquad\quad\;\; { { \sum_\limits{i=1}^{n} ( a_i \; - \; \bar a ) \; \times \; ( b_i \; - \; \bar b ) } \over { \sqrt { { \sum_\limits{i=1}^{n} ( a_i \; - \; \bar a )^2 } \; \times \; { \sum_\limits{i=1}^{n} ( b_i \; - \; \bar b )^2 } } } } } \) which corresponds to the equation given within the paper:
S. Bolte & F. P. Cordelieres
A guided tour into subcellular colocalization analysis in light microscopy
Journal of Microscopy, Volume 224, Issue 3: 213-232
doi:10.1111/j.1365-2818.2006.01706.xOverlap_R \( \Large = { { \sum_\limits{i=1}^{n} a_i \; \times \; b_i } \over { \sqrt { { \sum_\limits{i=1}^{n} a_i^2 } \; \times \; { \sum_\limits{i=1}^{n} b_i^2 } } } } \) \( = \sqrt { k_1 \times k_2 } \) with k1 \( \Large { = { { \sum_\limits{i=1}^{n} a_i \; \times \; b_i } \over { \sum_\limits{i=1}^{n} a_i^2 } } } \) and k2 \( \Large { = { { \sum_\limits{i=1}^{n} a_i \; \times \; b_i } \over { \sum_\limits{i=1}^{n} b_i^2 } } } \)
Average_a is the average intensity of the nb_pixels selected pixels of the first picture (i.e. \(\bar a\)) used for the calculation of the Pearson's coefficient Pearson's_Rr Average_b is the average intensity of the nb_pixels selected pixels of the second picture (i.e. \(\bar b\)) used for the calculation of the Pearson's coefficient Pearson's_Rr Sigma_a is the standard deviation of the intensity of the nb_pixels selected pixels of the first picture (i.e. \(\sigma_a\)) used for the calculation of the Pearson's coefficient Pearson's_Rr Sigma_b is the standard deviation of the intensity of the nb_pixels selected pixels of the second picture (i.e. \(\sigma_b\)) used for the calculation of the Pearson's coefficient Pearson's_Rr
M1 \( \Large = { \sum_\limits{i=1}^{n} a_{i,coloc} \over { \sum_\limits{i=1}^{n} a_i } } \) with \( \begin{cases} a_{i,coloc} = a_i & \text{if } b_i > b_{treshold} \\ \\ a_{i,coloc} = 0 & \text{if } b_i \leqslant b_{treshold} \\ \end{cases} \)
M1_norm \( \Large = { \sum_\limits{i=1}^{n} a_{i,coloc} \over { \sum_\limits{i=1}^{n} a_i } } \) with \( \begin{cases} a_{i,coloc} = 1 & \text{if } b_i > b_{treshold} \\ \\ a_{i,coloc} = 0 & \text{if } b_i \leqslant b_{treshold} \\ \end{cases} \)
M2 \( \Large = { \sum_\limits{i=1}^{n} b_{i,coloc} \over { \sum_\limits{i=1}^{n} b_i } } \) with \( \begin{cases} b_{i,coloc} = b_i & \text{if } a_i > a_{treshold} \\ \\ b_{i,coloc} = 0 & \text{if } a_i \leqslant a_{treshold} \\ \end{cases} \) E. M. Manders, F. J. Verbeek, J. A. Aten
Measurement of co-localization of objects in dual-colour confocal images
Journal of Microscopy, Volume 169, Issue 3: 375-382
doi.org/10.1111/j.1365-2818.1993.tb03313.x
M2_norm \( \Large = { \sum_\limits{i=1}^{n} b_{i,coloc} \over { \sum_\limits{i=1}^{n} b_i } } \) with \( \begin{cases} b_{i,coloc} = 1 & \text{if } a_i > a_{treshold} \\ \\ b_{i,coloc} = 0 & \text{if } a_i \leqslant a_{treshold} \\ \end{cases} \) E. M. Manders, J. Stap, G. J. Brakenhoff, R. Van Driel, J. A. Aten
A guided tour into subcellular colocalization analysis in light microscopy
Journal of Cell Science, 1992 Nov 1, 103(3):857-62
doi.org/10.1242/jcs.103.3.857
Slope of the linear fit of the nb_pixels pixels selected within the scatterPlot ROI Intercept of the linear fit of the nb_pixels pixels selected within the scatterPlot ROI nb_pixels is the number of pixels selected within the scatterPlot ROI %pixels is the percentage of pixels selected within the scatterPlot ROI
min_I1 is the lower intensity value of the first picture defined by the scatterPlot ROI max_I1 is the higher intensity value of the first picture defined by the scatterPlot ROI min_I2 is the lower intensity value of the second picture defined by the scatterPlot ROI max_I2 is the higher intensity value of the second picture defined by the scatterPlot ROI <first_picture> is the mean intensity value of the first picture <second_picture> is the mean intensity value of the second picture
Roi_color is the color of the ROI that have been set in the scatterPlot as well as for the pixels within the overlay added to the Composite picture when clicking inside of a ROI together with the Ctrl key pressed
The limits of the scatterPlot graph and/or of the scatterPlot Roi can be modified by pressing through "Set" button at the bottom left of the scatterPlot picture (or by pressing the 'g' key)
The Colocalization_Finder plugin version details as well as can be reached from the ImageJ Help>About_plugins>Colocalization_Finder...Help>About_plugins>Colocalization_Finder...:
Analysis of image stacks:
Macro functions:
run("Colocalization Finder", "image_1=picture1 image_2=picture2 scatterplot_size=[_256 x 256_]") Launch of the Colocalization_Finder finder plugin on the picture1 and picture2 pictures with a scatterPlot size of 256 × 256 pixels run("Colocalization Finder", "image_1=picture1 image_2=picture2 scatterplot_size=[_512 x 512_]") Launch of the Colocalization_Finder finder plugin on the picture1 and picture2 pictures with a scatterPlot size of 512 × 512 pixels run("Colocalization Finder", "image_1=picture1 image_2=picture2 scatterplot_size=[1024 x 1024]") Launch of the Colocalization_Finder finder plugin on the picture1 and picture2 pictures with a scatterPlot size of 1024 × 1024 pixels output = call("Colocalization_Finder.analyzeByMacro", "false", "false"); Generation of the analysis of a given cross (i.e. scatterPlot and Composite pictures) selection with the results being outputted within the output String with ';' as separator output = call("Colocalization_Finder.analyzeByMacro", "true", "false"); Generation of the analysis of a given cross (i.e. scatterPlot and Composite pictures) selection with the results being outputted within the output String with ';' as separator as well as within the 'Colocalization Finder Results' results table. output = call("Colocalization_Finder.analyzeByMacro", "true", "true"); Generation of the analysis of a given cross (i.e. scatterPlot and Composite pictures) selection with the results being outputted within the output String with ';' as separator as well as within the 'Colocalization Finder Results' results table with the addition of the scatterPlot selection within the roiManager attributing a given color to the corresponding ROI and colorizing the selected pixels within the Composite picture with the same attributed color by adding an overlay (equivalent to Crtl + click inside a ROI). output = call("Colocalization_Finder.analyzeByMacro", "false", "true"); Generation of the analysis of a given cross (i.e. scatterPlot and Composite pictures) selection with the results being outputted within the output String with ';' as separator as well as the addition of the scatterPlot selection within the roiManager attributing a given color to the corresponding ROI and colorizing the selected pixels within the Composite picture with the same attributed color by adding an overlay (equivalent to Crtl + click inside a ROI). output = call("Colocalization_Finder.analyzeByMacro", "false", "false", 3); Generation of the analysis of a given cross (i.e. scatterPlot and Composite pictures) selection with the results of the first column (i.e. of the Pearson's_Rr parameter) being outputted within the output String output = call("Colocalization_Finder.analyzeByMacro", "false", "false", "3,6"); Generation of the analysis of a given cross (i.e. scatterPlot and Composite pictures) selection with the results of the first and fourth columns (i.e. of the Pearson's_Rr and Sigma_b parameters) being outputted within the output String with ';' as separator output = call("Colocalization_Finder.analyzeByMacro", "false", "false", "3,6-9"); Generation of the analysis of a given cross (i.e. scatterPlot and Composite pictures) selection with the results of the first and fourth to seventh columns (i.e. of the Pearson's_Rr, Sigma_a, Sigma_b, Overlap_R and k1 parameters) being outputted within the output String with ';' as separator output = call("Colocalization_Finder.analyzeByMacro", "false", "false", "3,6-9", "\t"); Generation of the analysis of a given cross (i.e. scatterPlot and Composite pictures) selection with the results of the first and fourth to seventh columns (i.e. of the Pearson's_Rr, Sigma_a, Sigma_b, Overlap_R and k1 parameters) being outputted within the output String with '\t' (i.e. a tabulation) as separator call("Colocalization_Finder.setScatterPlotRoi", 90, 170, 100, 140); Setting of the scatterPlot ROI limits to the positions 90, 170, 100 and 140 call("Colocalization_Finder.setScatterPlotRoi", '', '', '', ''); Setting of the scatterPlot ROI limits to the minimal and maximal intensity values of the scatterPlot graph call("Colocalization_Finder.setScatterPlotLimits", 0, 5000, 100, 2000); Setting of the scatterPlot graph limits between the intensity values of 0 and 5000 for the first picture and 100 to 2000 for the second picture call("Colocalization_Finder.setScatterPlotLimits", '', '', '', ''); Setting of the scatterPlot graph limits between the minimal and maximal intensity values of the first and second pictures call("Colocalization_Finder.getResultsLinesCount"); Get the number of lines within the Colocalization_Finder_Results window How to:
How can I export the scatter plot data within a spreadsheet software? The scatter plot data are under the form of a picture, thus in order to export them into a spreadsheet software all what is needed is to take care that the scatter plot ROI is covering all the plot surface in order to copy all the data.
If this isn't the case don't try to increase the scatter plot ROI size but just perform a left mouse click outside the the scatter plot surface but within the scatter plot window which will then maximize the ROI size similarly how it was upon the launch of the plugin.
Then perform an Image>Duplicate (or Shift + d) in order to duplicate the plot and you are all set.
The following macro code allows later on to extract the data into a Log window using the tabulation as delimiter so that it can be copied / pasted into a spreadsheet software with the data formatted into columns:
for(i = 0; i < getWidth(); i++)
for(j = 0; j < getHeight(); j++)
print(i + "\t" + j + "\t" + getPixel(i, j));
Alternatively it is as well possible to export the data with the File>Save_as>Text_image... tool The following macro is performing the operations described higher and storing the data in a results window.How can I export the selected pixels within the composite picture into the ROI Manager? The selected pixels within the composite picture being drawn as an overlay, they can be imported into the ROI Manager by using the Image>Overlay>To_ROI_Manager tool as implemented in the following macro. How can I transform my two initial pictures in intensity into r vs θ pictures based on their intensity values and analyze them? The following macro is performing the operations. Validity verification:
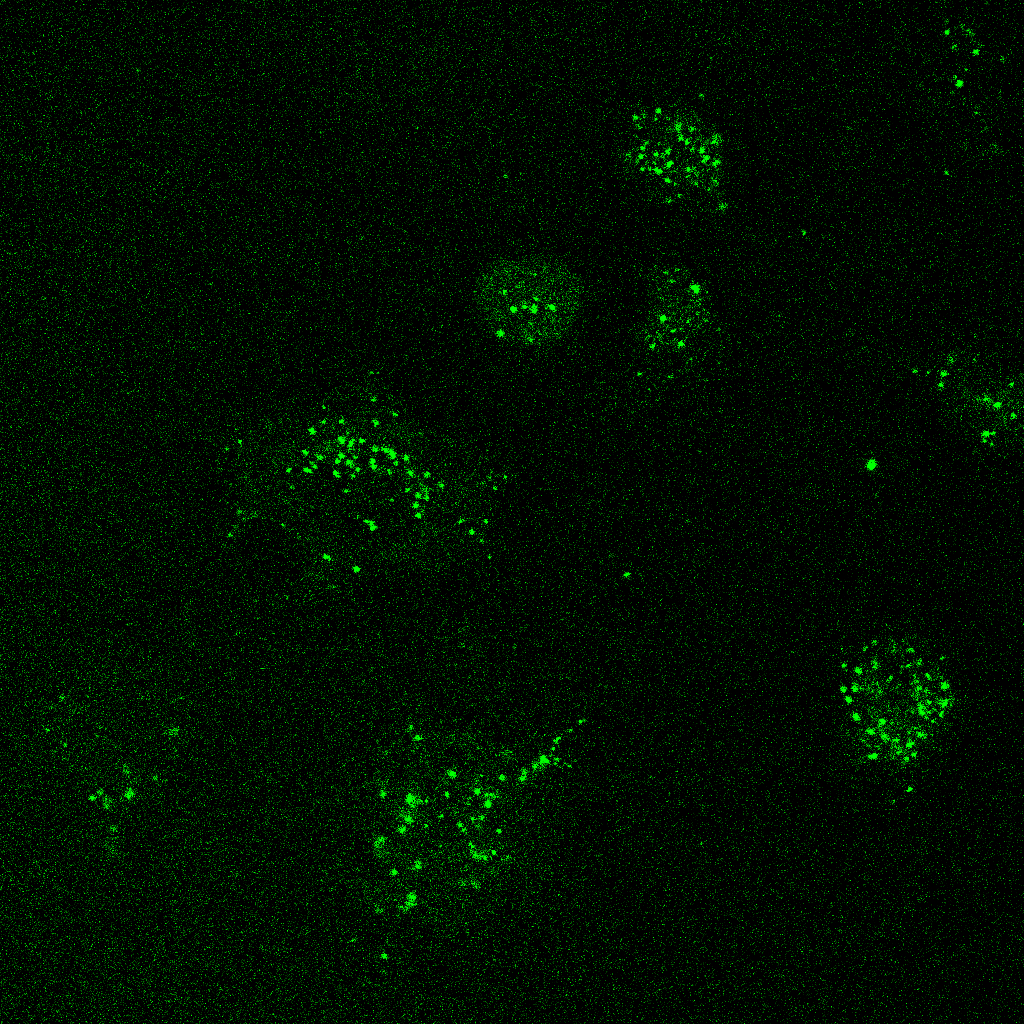
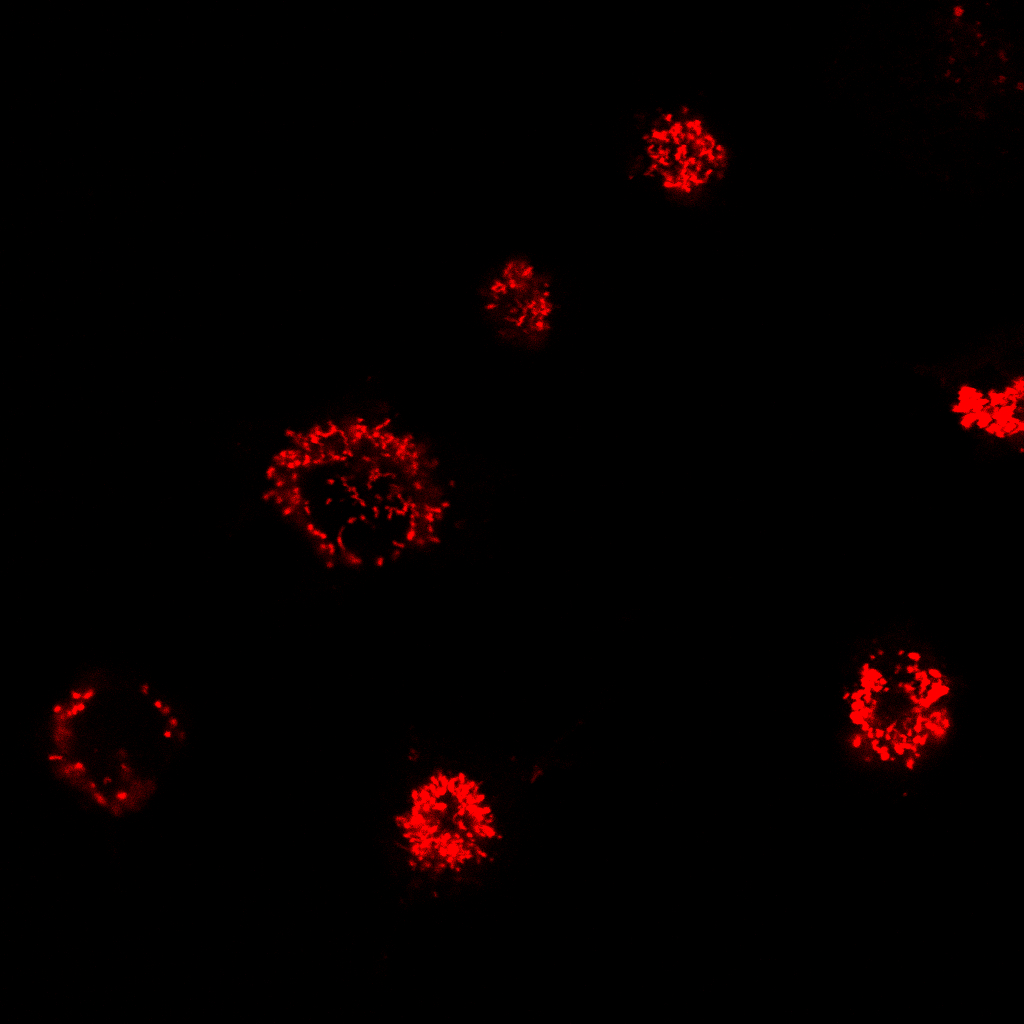
This verification is performed by using the two following pictures
Colocalization Exclusion Colocalization Coloc Rand Random Random Pearson ≈ 1 Pearson ≈ -1 Pearson ≈ 1 Pea ≈ 1 Pea ≈ 0 Pearson ≈ 0 Pearson ≈ 0 launched through the following macro. Webinar: A webinar on how to use the plugin can be seen here: